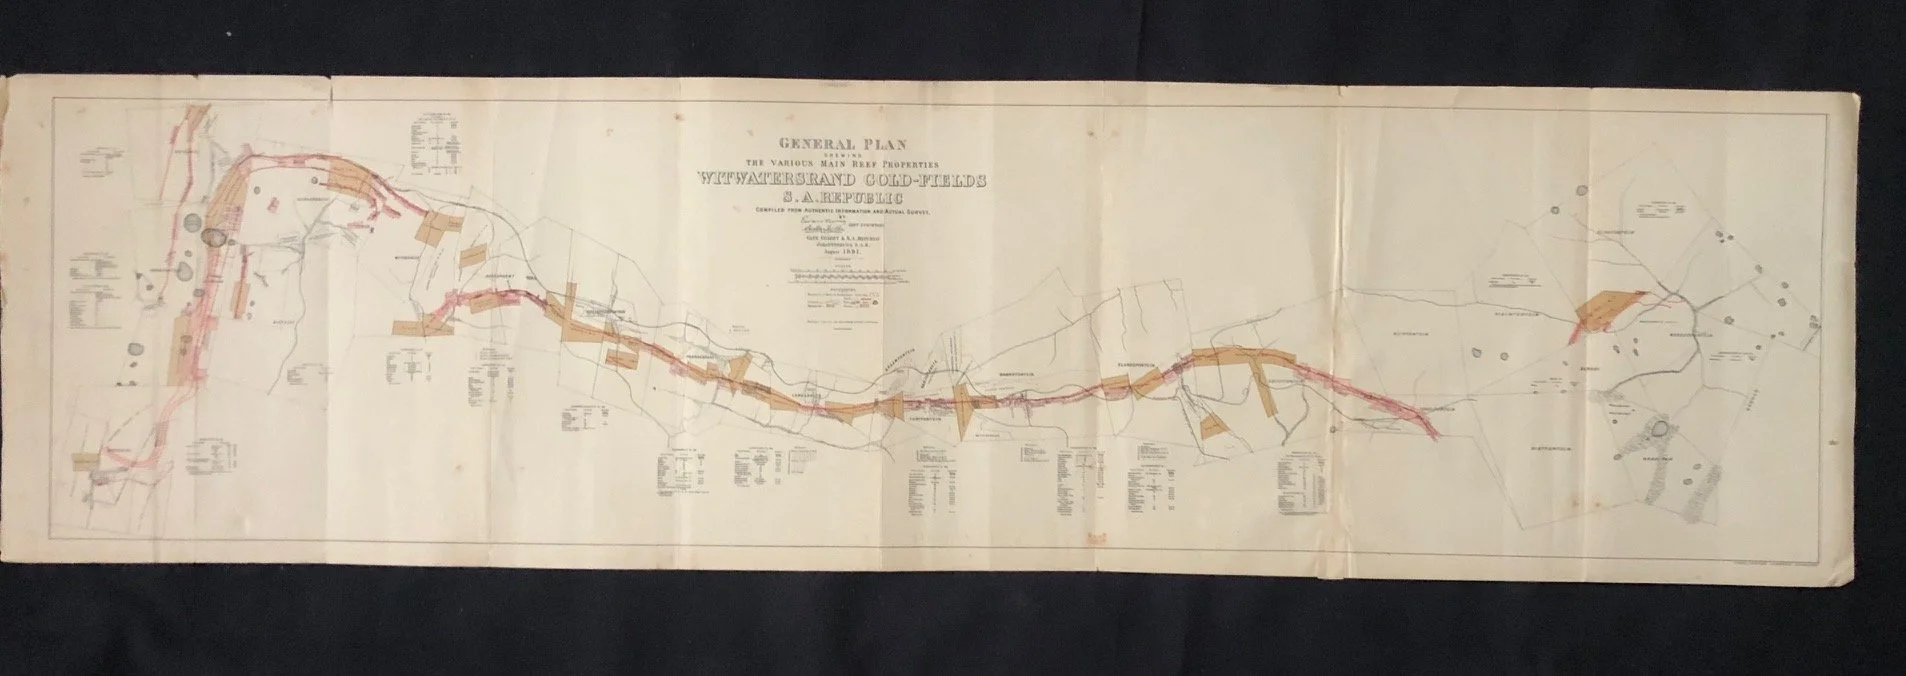
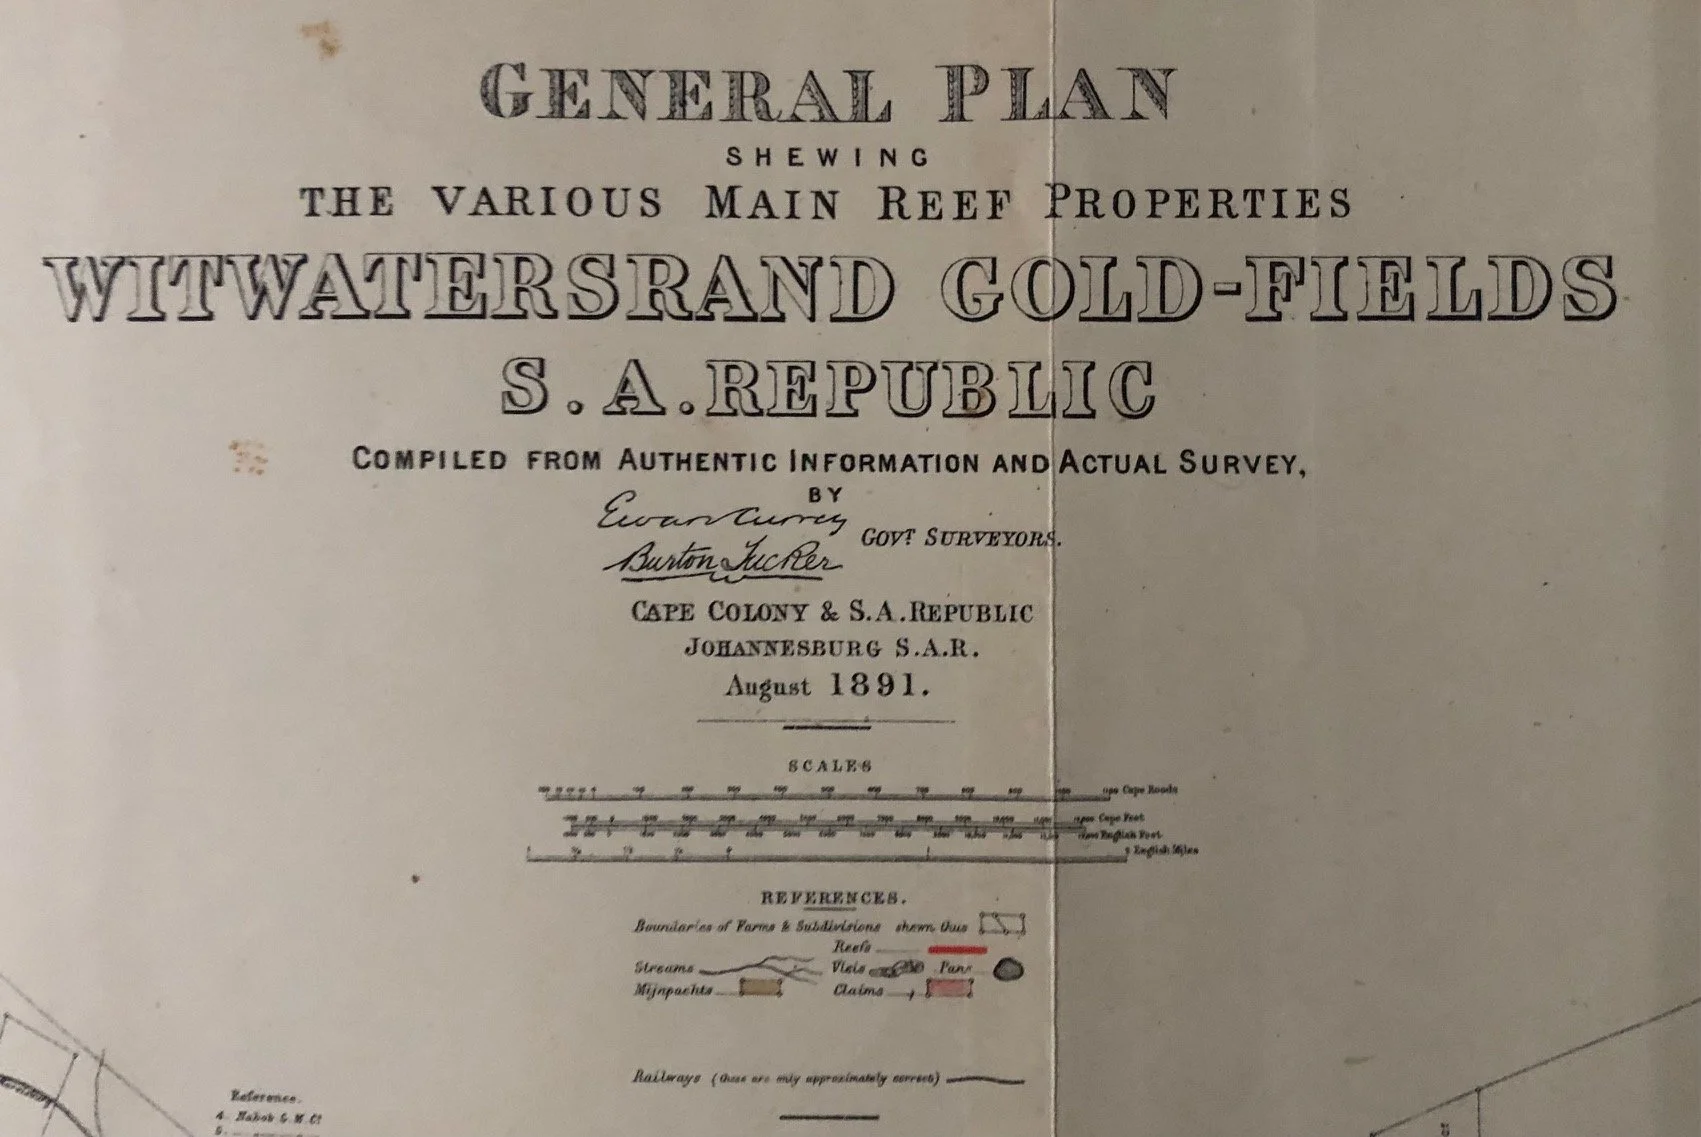
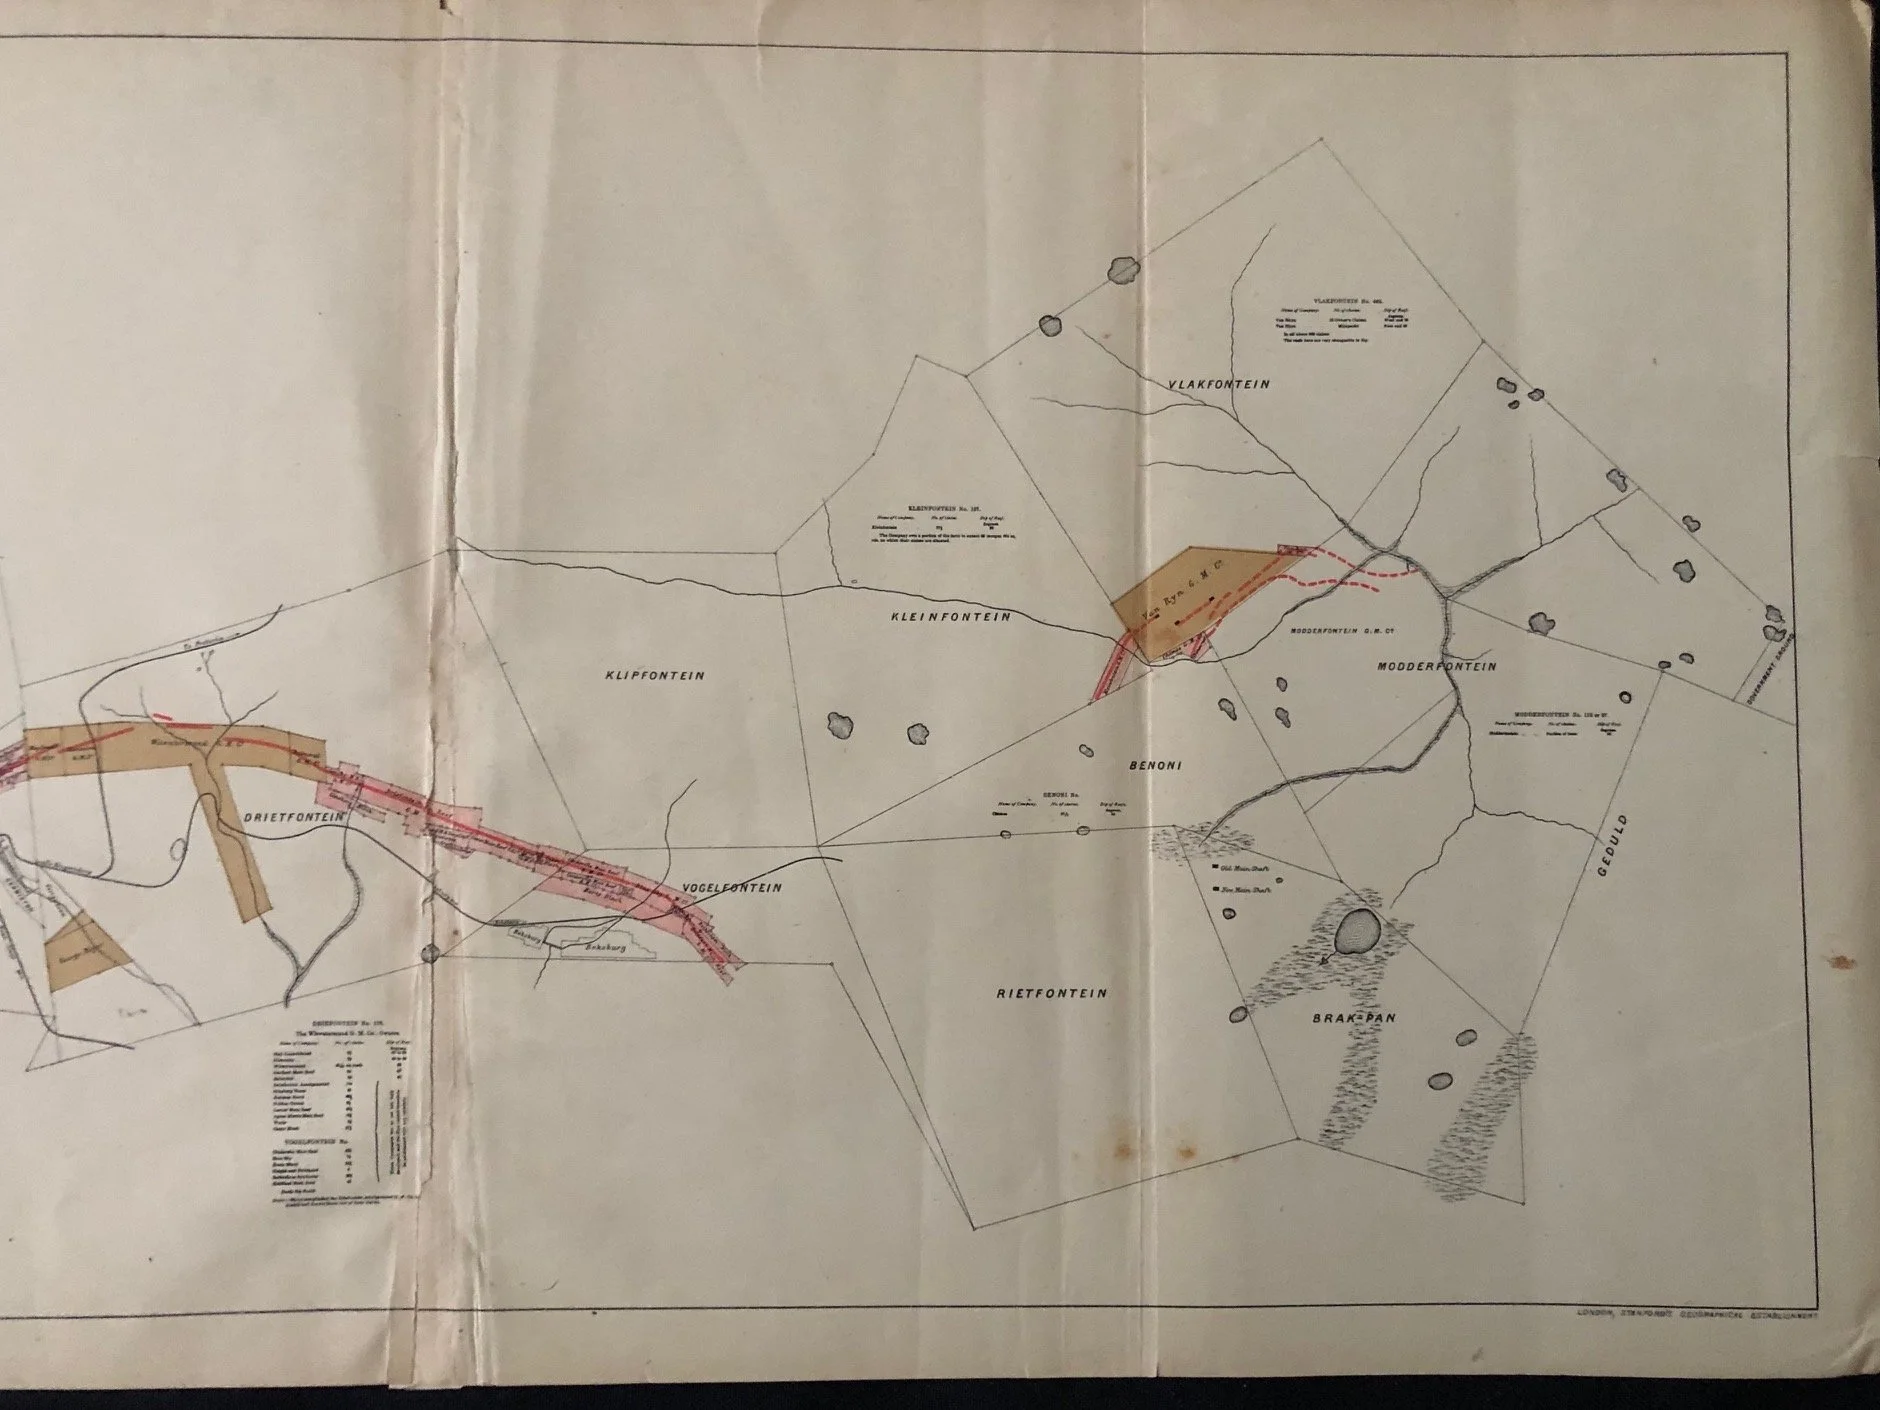
General Plan of The Witwatersrand Gold-Fields 1891
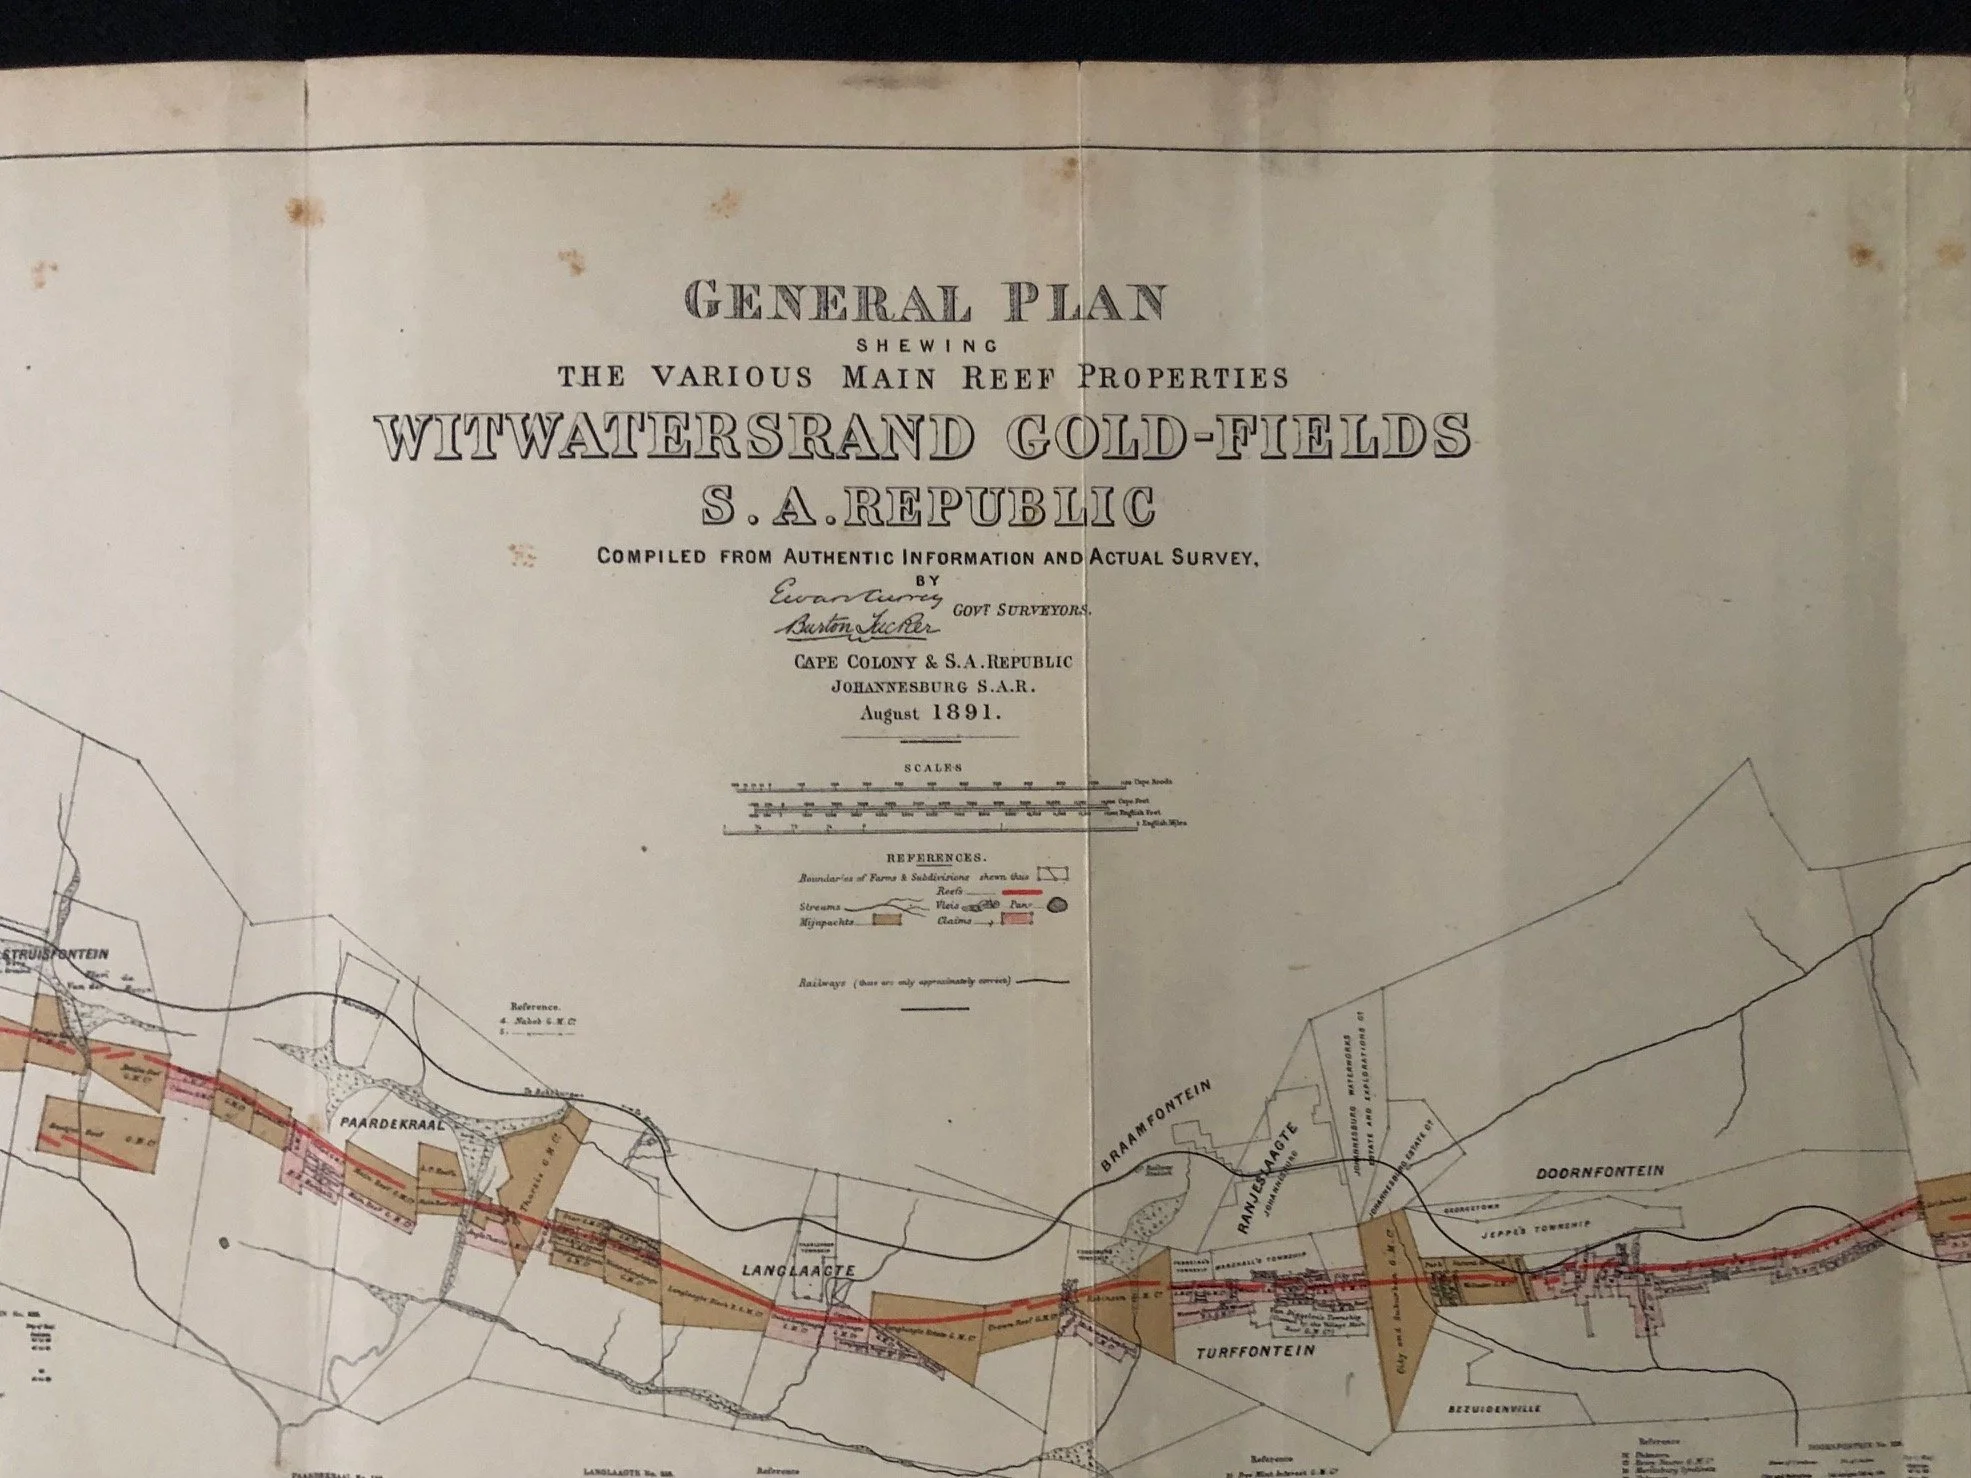
Ewan Currey and Burton Tucker "General Plan shewing the Various Main Reef Properties, Witwatersrand Gold-Fields, 1891"
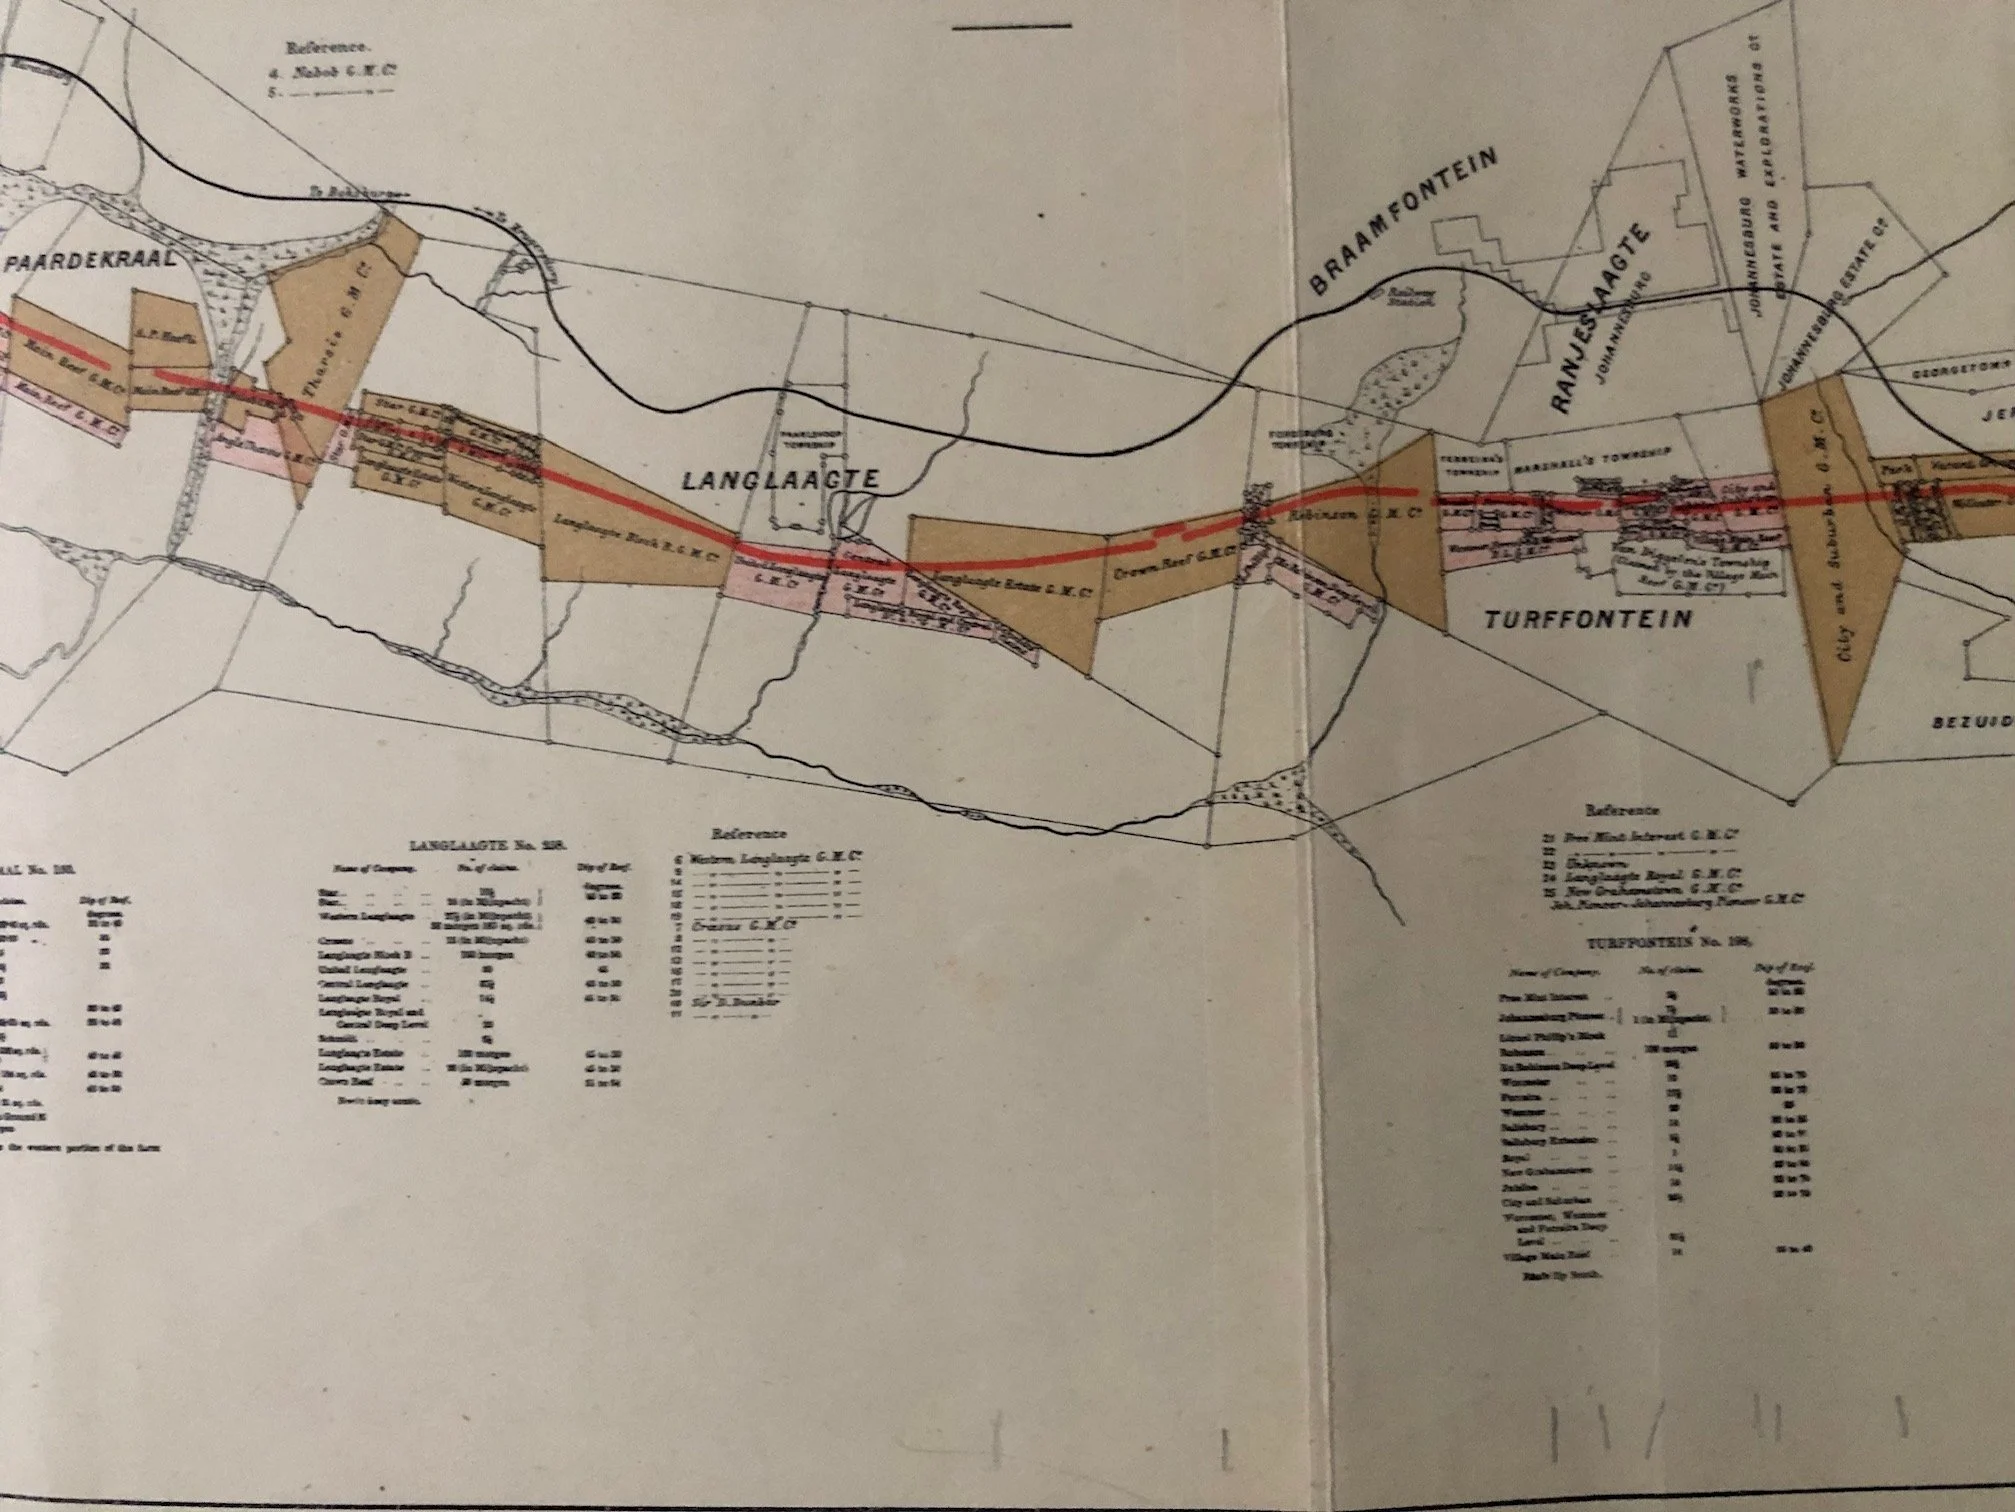
Produced just five years after George Harrison’s initial 1886 discovery of gold on the farm Langlaagte, visible center-left.
The Mapping of the "Mijnpachts" and the Birth of Corporate Mining
The plan represents the original Mijnpachts (mining leases) and farm boundaries granted under the early ZAR (Zuid-Afrikaansche Republiek) Gold Law.
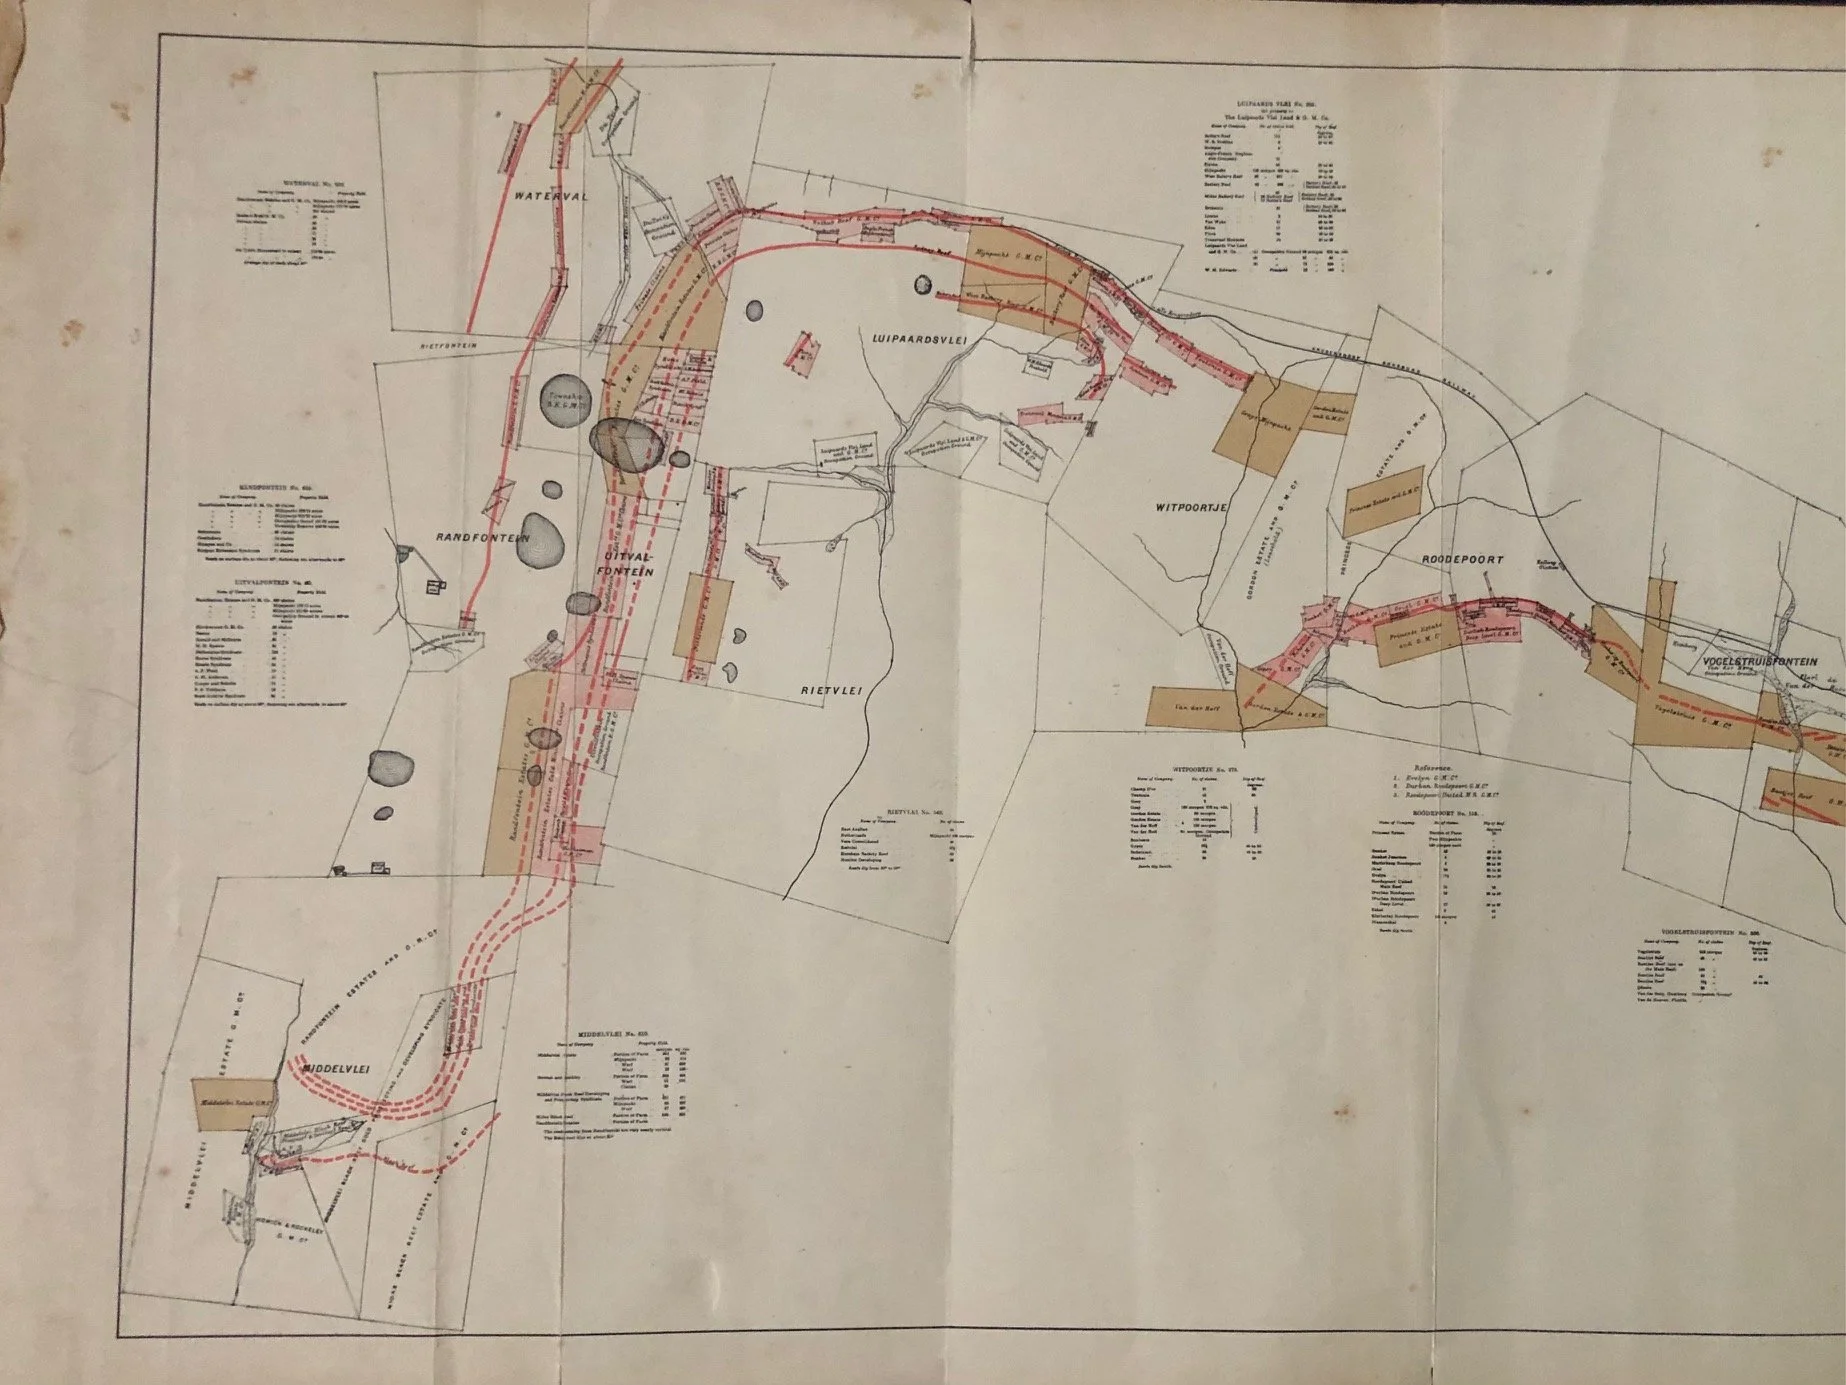
By August 1891, the chaotic, individual "pick-and-shovel" digger era was already collapsing. Because the Witwatersrand gold was locked in deep-level conglomerate rock (banket) rather than loose alluvial soil, it required massive capital, chemical extraction (the MacArthur-Forrest cyanide process was introduced right around this time, in 1890), and heavy machinery. This map captures the exact moment independent farms like Braamfontein, Turffontein, and Doornfontein were being carved up into the corporate mining concessions that birthed the Randlords.
Johannesburg as an "Unintended" Geopolitical Time Bomb
The plan was produced in Johannesburg, S.A. Republic (ZAR), under President Paul Kruger. Kruger’s government originally hoped the gold would dry up quickly, viewing the influx of foreign miners (Uitlanders) with intense suspicion. Instead, maps like this proved the reef was vastly extensive. Within eight years of this map being drafted, the geopolitical tension over the wealth and political rights of the people living on these very blocks of land would trigger the Second Anglo-Boer War (1899–1902).
The Cartographers: Currey & Tucker
Ewan Currey and Burton Tucker were among the most prominent government surveyors of the late-nineteenth-century Cape and Transvaal. Mapping a goldfield that was changing by the week was a monumental task. They had to reconcile haphazard farm boundaries drawn up by early Trekboers (who often measured farm sizes by walking a horse for an hour in each direction) with the precise, high-stakes geometry required by international mining syndicates.
The sheer horizontal format perfectly reflects the geology of the Rand—following the narrow, incredibly wealthy arc of the Main Reef leader rather than traditional regional geography.
Tears, repairs, some foxing, creased.
935mm x 245mm
R4,000